ReportPlus Data Analytics app for iPhone and iPad
ReportPlus is a true self-service BI tool for your business that allows you to securely access and transform your data to gain new insights and make smarter decisions faster. Become empowered to easily create, edit and share interactive real-time insights and KPIs providing an effective data-driven approach that every business needs on any platform to stay on top of your organization.
Highlights:
• Stay on top of your organization with real-time insights and KPIs
• A familiar drop and drag experience to connect the most popular data sources
• Swipe and quickly choose visualization types
• Tap a field to set filters
• Save your dashboard on premise or in the Cloud
• One click to share your story with everyone
• Choose from over 30 visualization types to create robust dashboards and quickly style them with preset themes to customize colors and fonts
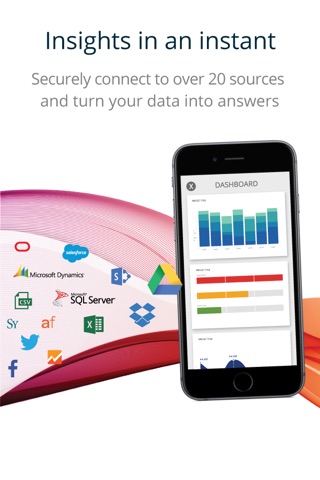
• Connect to today’s most popular data sources
Connect to live data:
• Spreadsheets: Excel, CSV, Google Sheets.
• Content Managers: Dropbox, Google Drive, SharePoint, Box, OneDrive.
• CRMs: SalesForce, Microsoft Dynamics CRM.
• Datastores: SQL Server, Analysis Services, SSRS, MySQL, Oracle, Sybase, PostgreSQL, Hadoop Hive.
• Social: Facebook, Twitter.
• Analytics: Google Analytics, appFigures.
• Many more: OData service, IMAP Mail Server, User Voice, Web Resource.
Combine 2 data sources into one visualization as well!
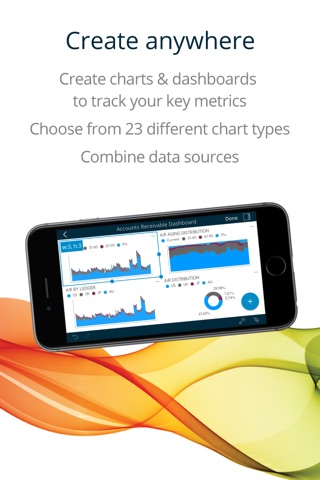
Create anywhere:
• Create charts and dashboards on your iPhone, iPad, or desktop computer.*
• Choose from 23 different visualization types including bar, column, donut, area, stacked, bubble, and pie charts, maps, tables, KPI gauges, and many more.
• Create interactive charts and dashboards that can be filtered, sorted, drill down into data, link dashboards.
• Quickly design with over 20 beautiful themes.
• Custom SQL queries right from your device.
• Bring your own custom visualizations into ReportPlus.
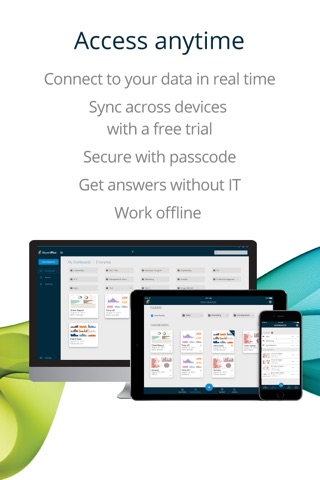
Access anytime:
• Sync and access your dashboards on your iPhone, iPad, and your desktop computer.*
• Secure your data with a passcode. Use TouchID to unlock it.
• Get answers without IT, No server side component required.
• Work offline.
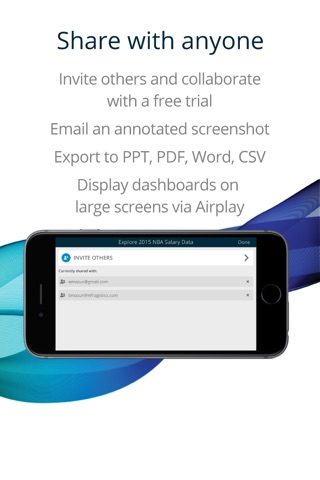
Share with anyone
• Invite others and collaborate.*
• Email an annotated screenshot.
• Nail your next presentation by exporting your dashboards and charts to PPT, PDF, and Word with your branding.
• Display dashboards on large screens via Airplay or HDMI.
It’s easy to get started
• Already use ReportPlus? Download the app for FREE and sign-in with your ReportPlus account.
• New to ReportPlus? Download the app, create two free dashboards. No credit card required, and no obligation to purchase.
Subscribe
The ReportPlus subscription is optional, and the subscription features are available via an auto-renewing subscription.
ReportPlus offers a subscription of 1 year for $ 99.99.
Payments will be charged to your credit card through your iTunes account after confirmation of purchase. Your subscription will automatically renew unless cancelled at least 24-hours before the end of the current period.
Your subscription can be managed in your iTunes Account Settings after purchase. Subscriptions cannot be cancelled for the current active period.
To learn about our privacy policy visit: http://www.infragistics.com/legal/privacy
For the Terms of Use visit: https://www.infragistics.com/legal/terms-of-use
*Available with a subscription.
Pros and cons of ReportPlus Data Analytics app for iPhone and iPad
ReportPlus Data Analytics app good for
Our company purchased ReportPlus for senior management to share dashboards. The app creates dashboards with various chart types and options. We studied the App Store to find such an app and found dashboard to be the best out of all available options. We encountered a few technical issues at the beginning and was pleasantly surprised to find Infragistics technical staff to be super responsive and very cooperative. They went out of their way to resolve the issues we faced. We highly recommend this app and the technical team behind this developer to organizations who want to report their performance on mobile devices.
If you want to build great visualizations for mobile consumption, check it out.
This is one of the best business application ever. Easy to create graphics and PIVOT TABLES. Easier even than Excel. I was looking for it a very long time. If they fix some minor bugs with negative numbers the evaluation will be the highest. Exciting!!!!!!
Wonderful and easy way to create Pivots on the fly or prepare for reuse. Never seen a better tool for this purpose. Invest the money. It is worth it.
This is far and away the best app I have seen for dynamic reporting on just about any platform.
It makes Sharepoint lists truly useable and reportable.
Great job, great value for money
I have been looking for an app like this for some time, one that gives my mobile users easy access to our data, but without costing a fortune. We have been very impressed with the functionality and will be rolling the app to all of our Area Managers. The early versions had a few quirks, but overall we have found the product to be extremely flexible simple to use. The potential benefits to our business are enormous and I am sure we will continue to expand upon its use.
Some bad moments
Report Plus promises a easy to use and flexible solution for dashboard creation and sharing on iPad. It partially delivers its promises but seems to be useless due to several frequent crashes while performing basic tasks like filtering results, changing dates etc.
Maybe solved on the next version but it was promised for two weeks ago and nothing happened till then. A shame.
No matter what I did, every time I tried to connect a MySQL data source, this died.
Title says it all. The only addition I would have like to see in to initial release is better local files/inbox integration. Outstanding first release though.
While this is a good app. It does not allow for sizing of columns and other polishing steps. Maybe in the future.
I have been using this app over the past 2 month. As much as I liked it, I was disappointed that you could not just refresh data on a local file. And was I surprise with the latest update, NOW YOU CAN. This is really a great app for anyone who needs to give regular reports on data. The ability do quickly creat nice looking charts, graphs, trend lines etc is amazing. Then to top it off you export it in to a very nice slide presentation. The one thing I would like to see is the ability to put your own logo on the slide template. It has the ReportPlus Pro logo, (not bad but for a presentation you want your own logo). There are way to many details to review here with this app, but it has been well thought out, and includes about anything you need for creating a dashboard. And to top this off the support is outstanding. Quick turn around time to email and actually help you. Look no more if you need to creat dashboards for reports. Great app!!!!!!
This app is an incredibly powerful and versatile tool for drawing together data from a variety of sources and displaying it in a meaningful manner. Thus far I have used it with several .csv files exported from our corporate BI software as well as a large number of SharePoint lists and continue to be impressed with how well it works. The description of this app as a self-service BI solution is absolutely correct and I couldnt be more pleased.
Immediately after purchasing the app I contacted support for help with a minor issue related to our implementation and they have been very helpful and professional in reaching a resolution. I have nothing but the highest praise for the service we have received thus far. Many thanks!
Usually ReportPlus Data Analytics iOS app used & searched for
reports+ analytics,
sharepoint mobile,
olap,
and other. So, download free ReportPlus Data Analytics .ipa to run this nice iOS application on iPhone and iPad.